How to find a dashboard in Grafana
Search for a dashboard in Grafana by name, open its folder and open the dashboard. Highlighted screenshots and a narrated video for each step.
- 4 steps
- Video 0:36
- Checked 17 November 2026
- Made with FlowMentor
Narrated video with captions, made by FlowMentor from the same recording.
Steps
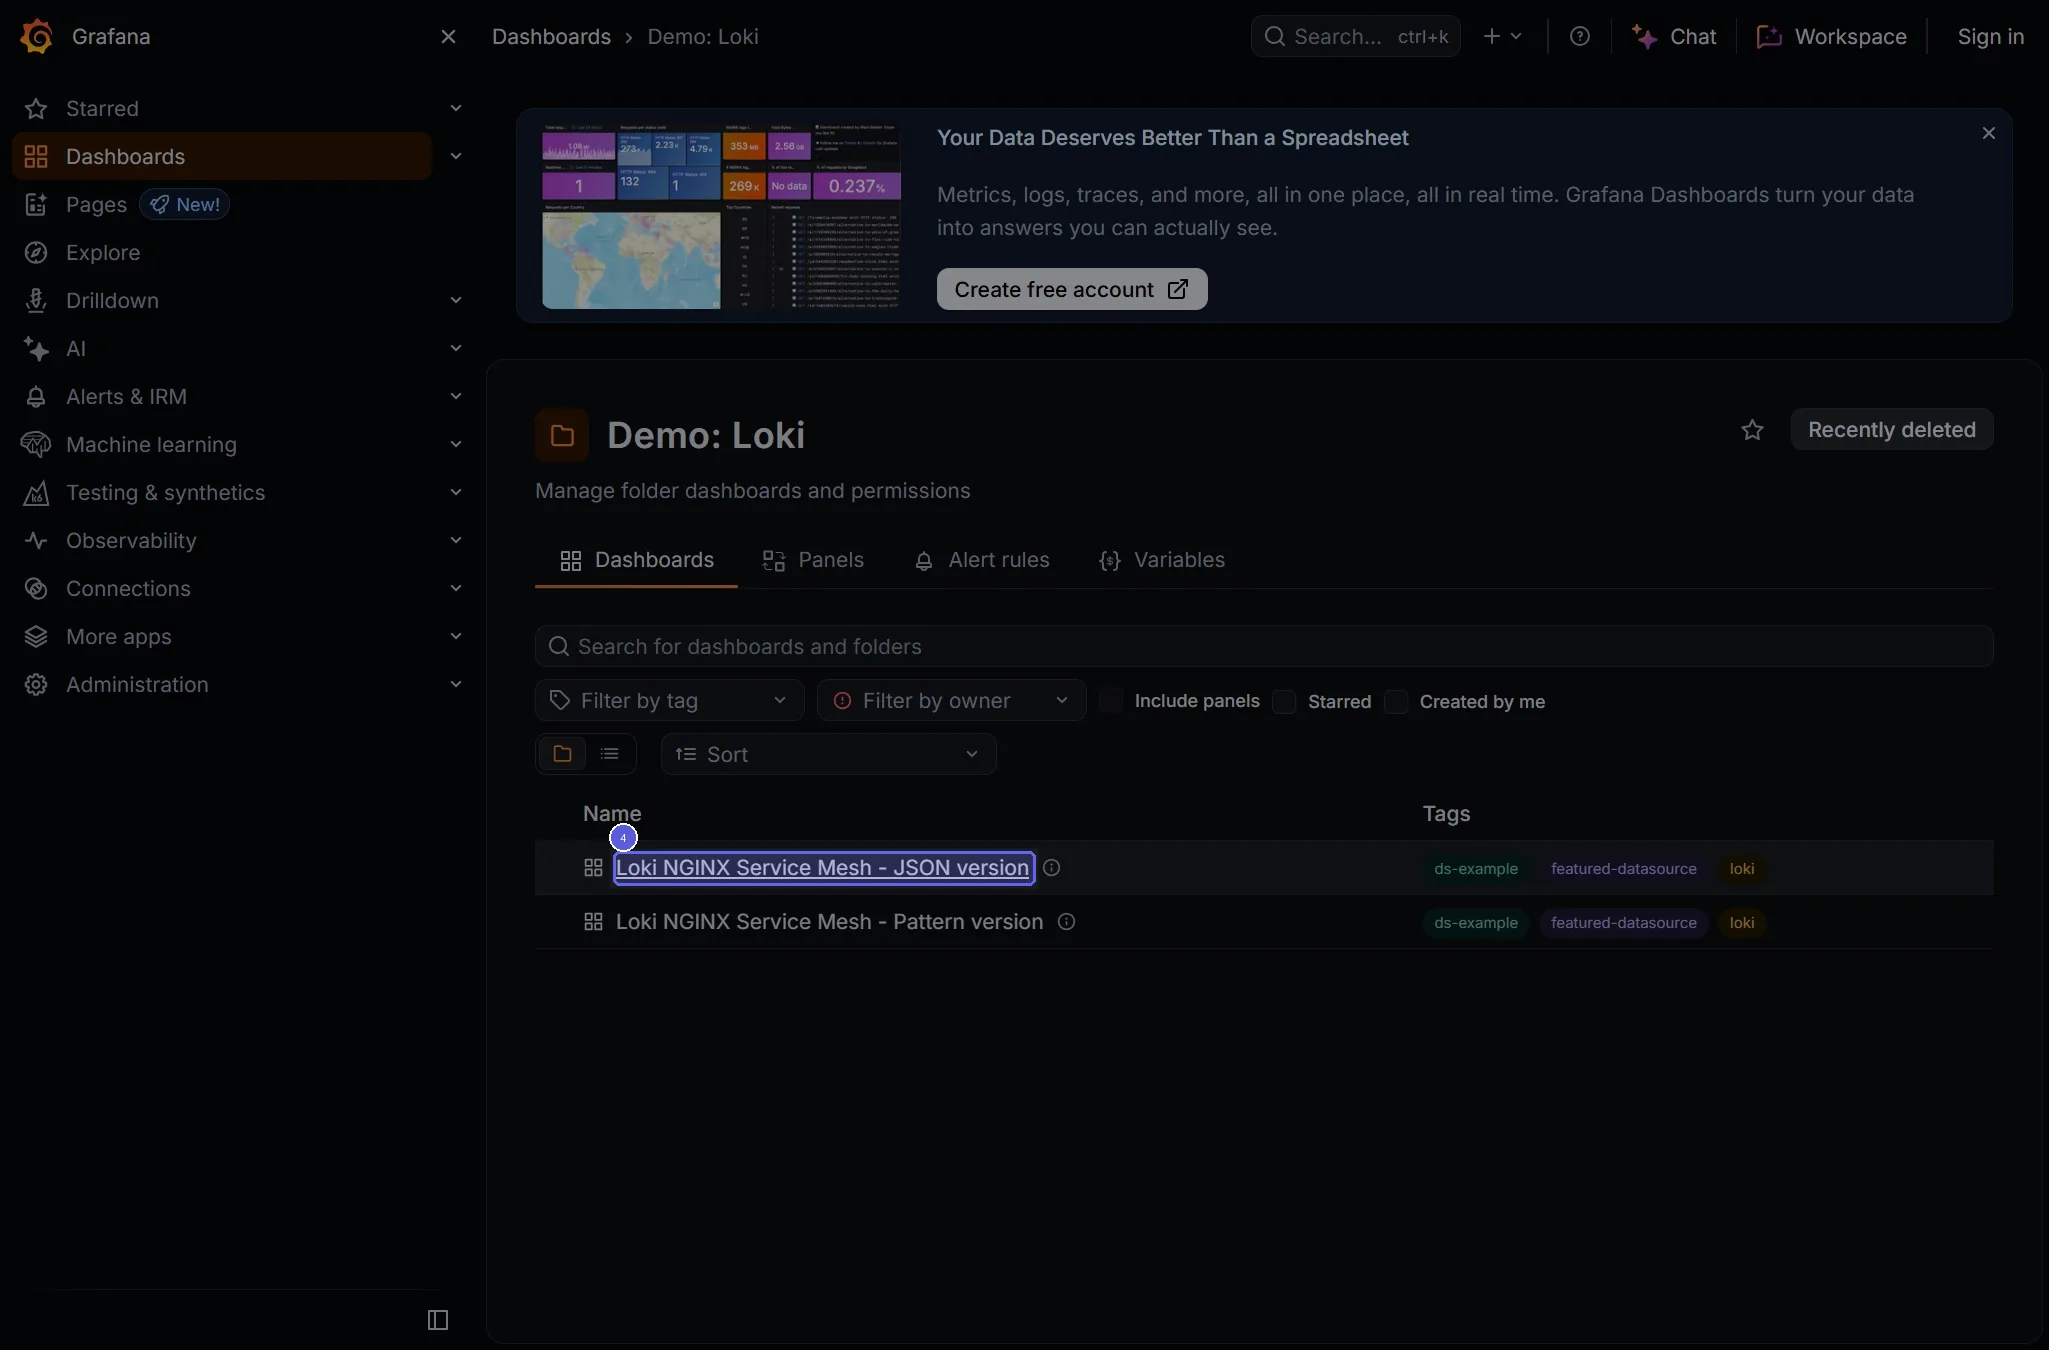
Step 1: Click on the Search for dashboards and folders field
Start on the "Dashboards" page.
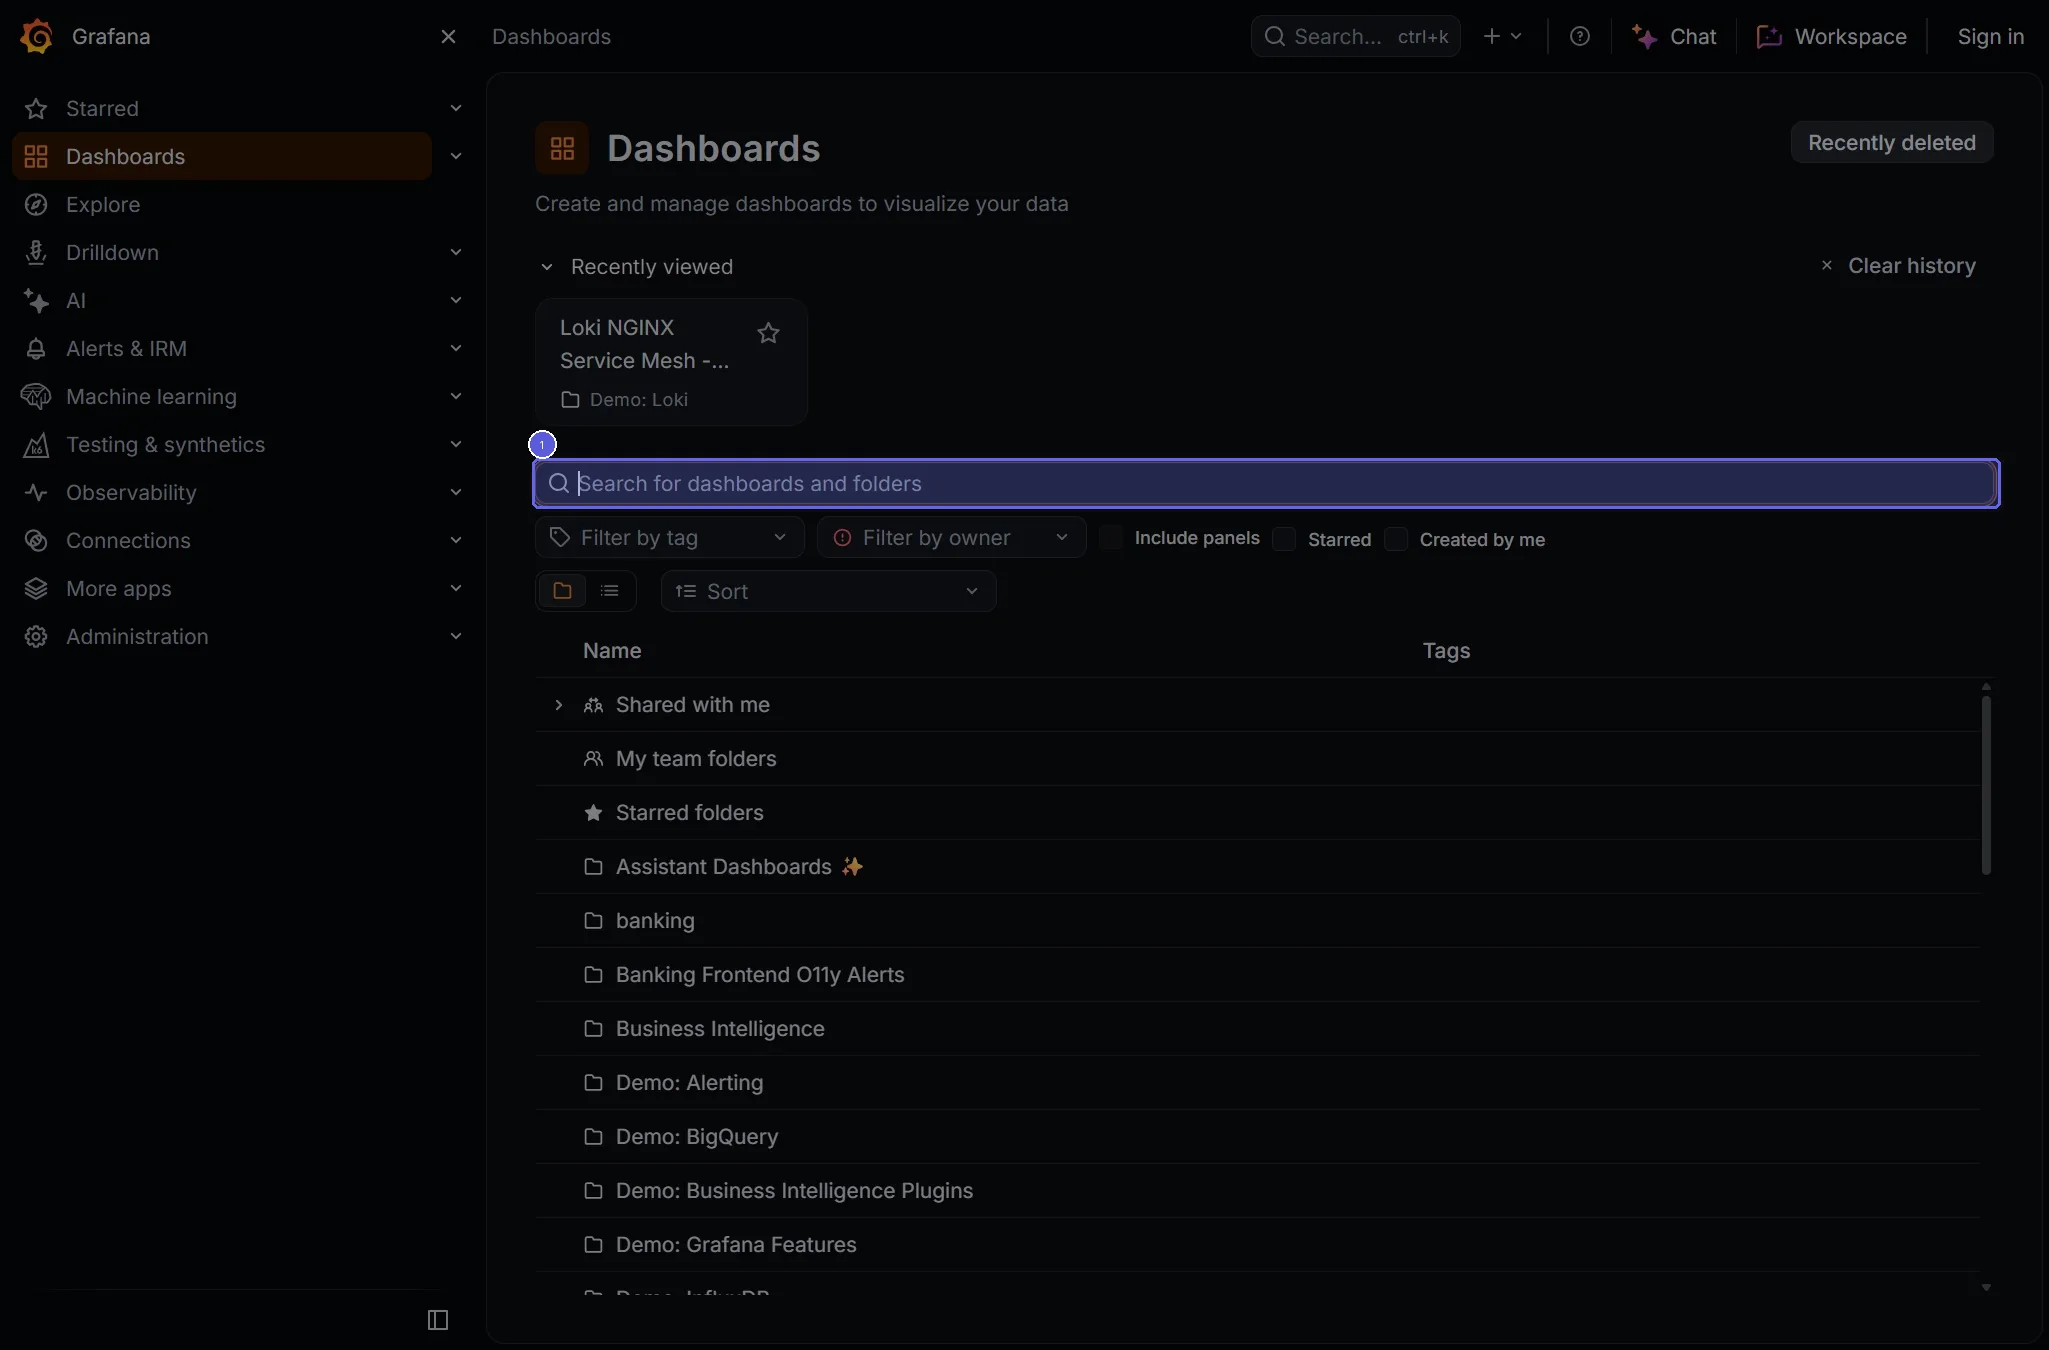
Step 2: Enter "Loki" in Search for dashboards and folders
Type the value that fits your case in the Search for dashboards and folders field. The recording used "Loki".
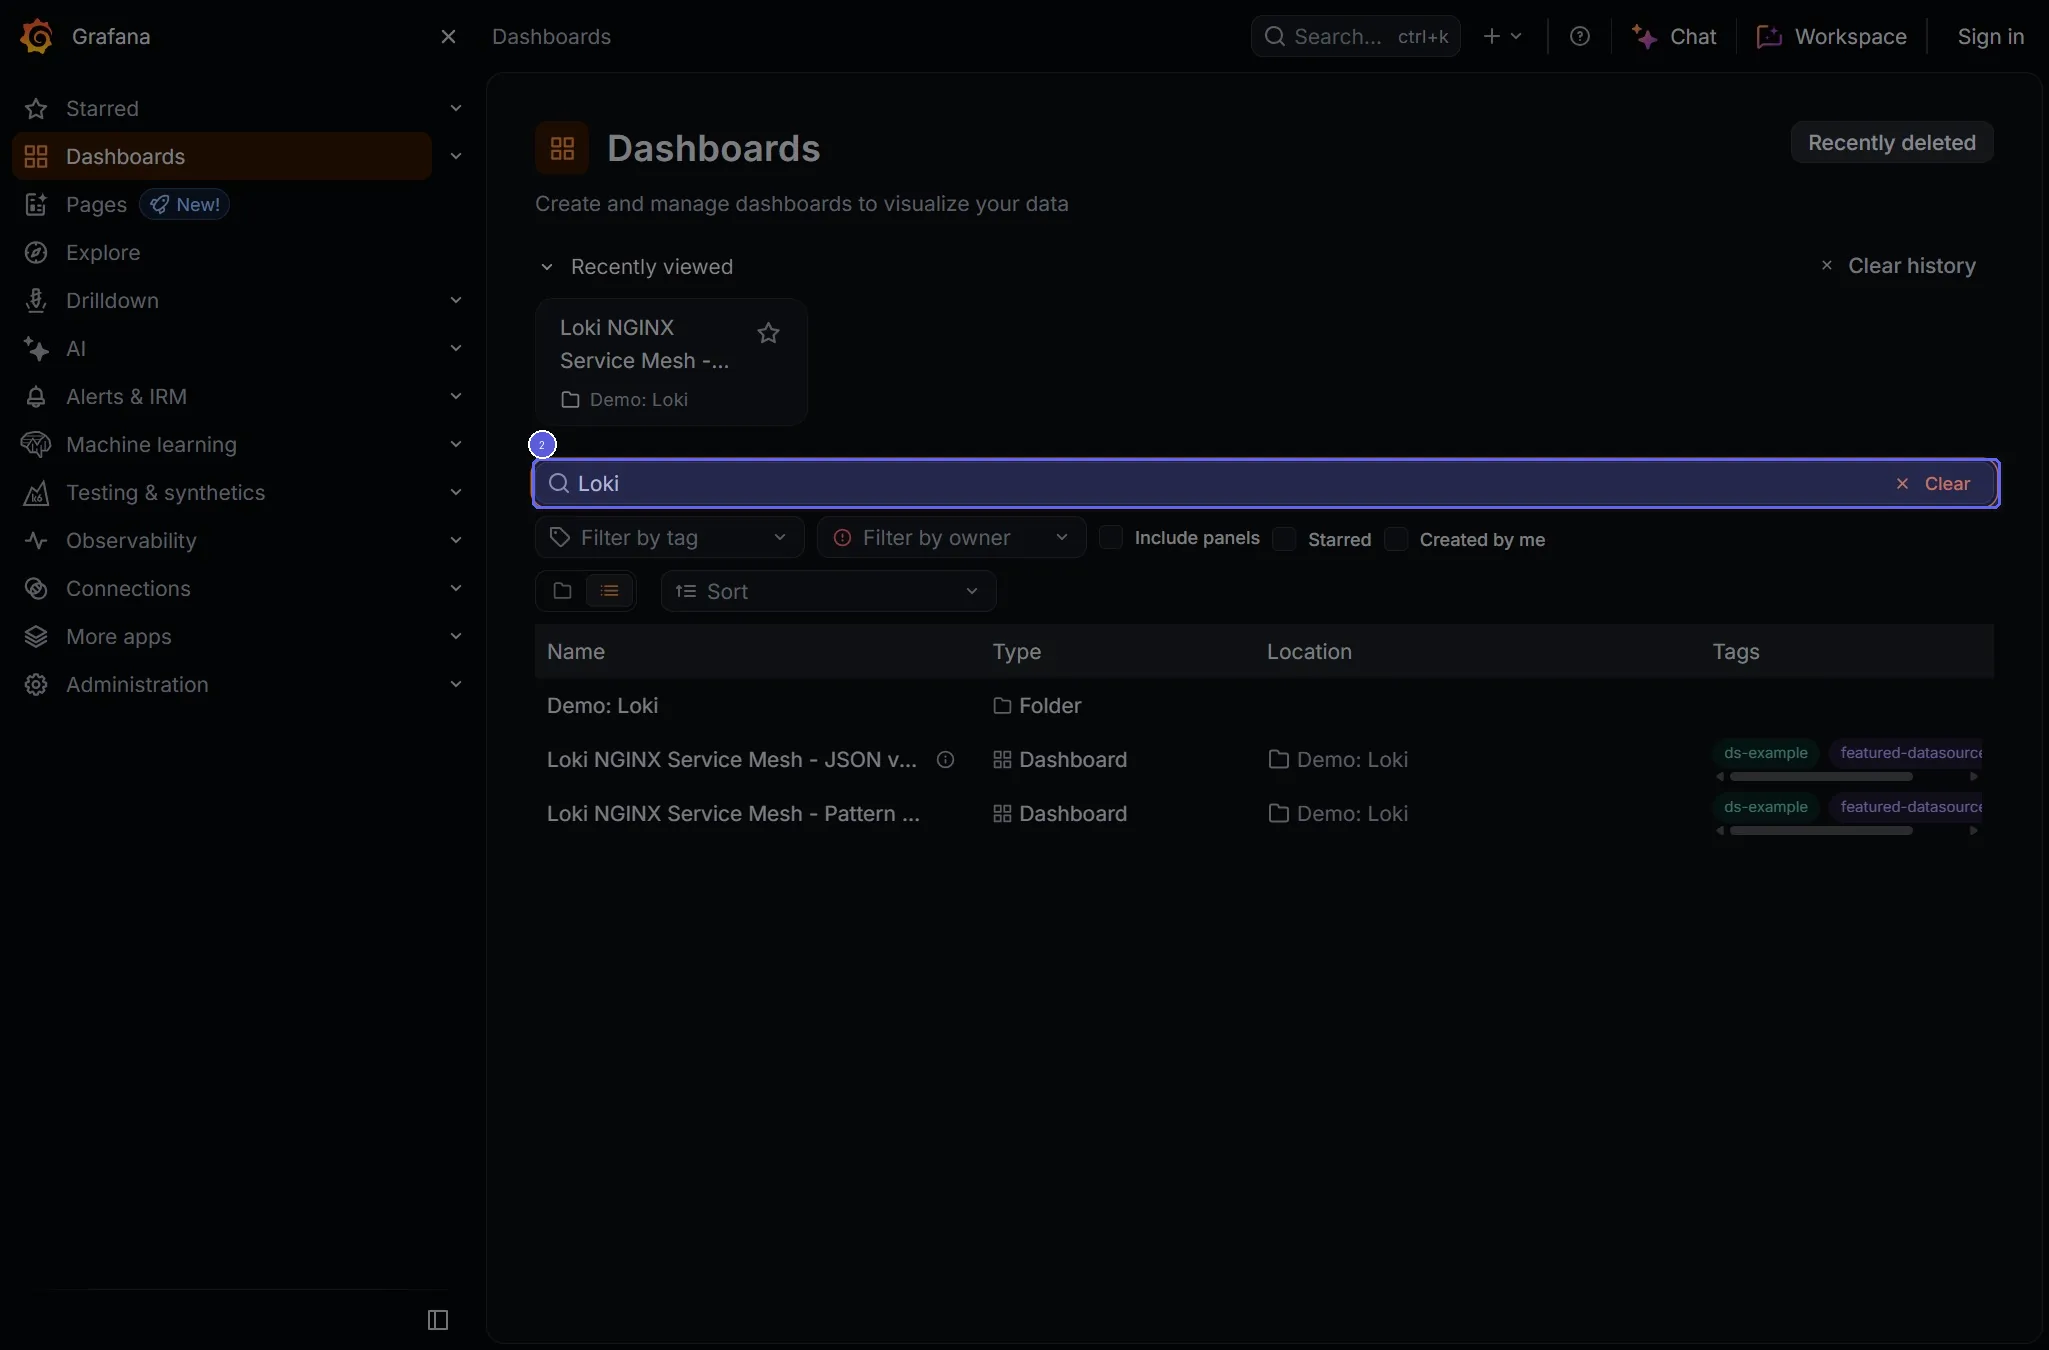
Step 3: Click the "Demo: Loki" link
This opens the "Demo: Loki · Dashboards" page.
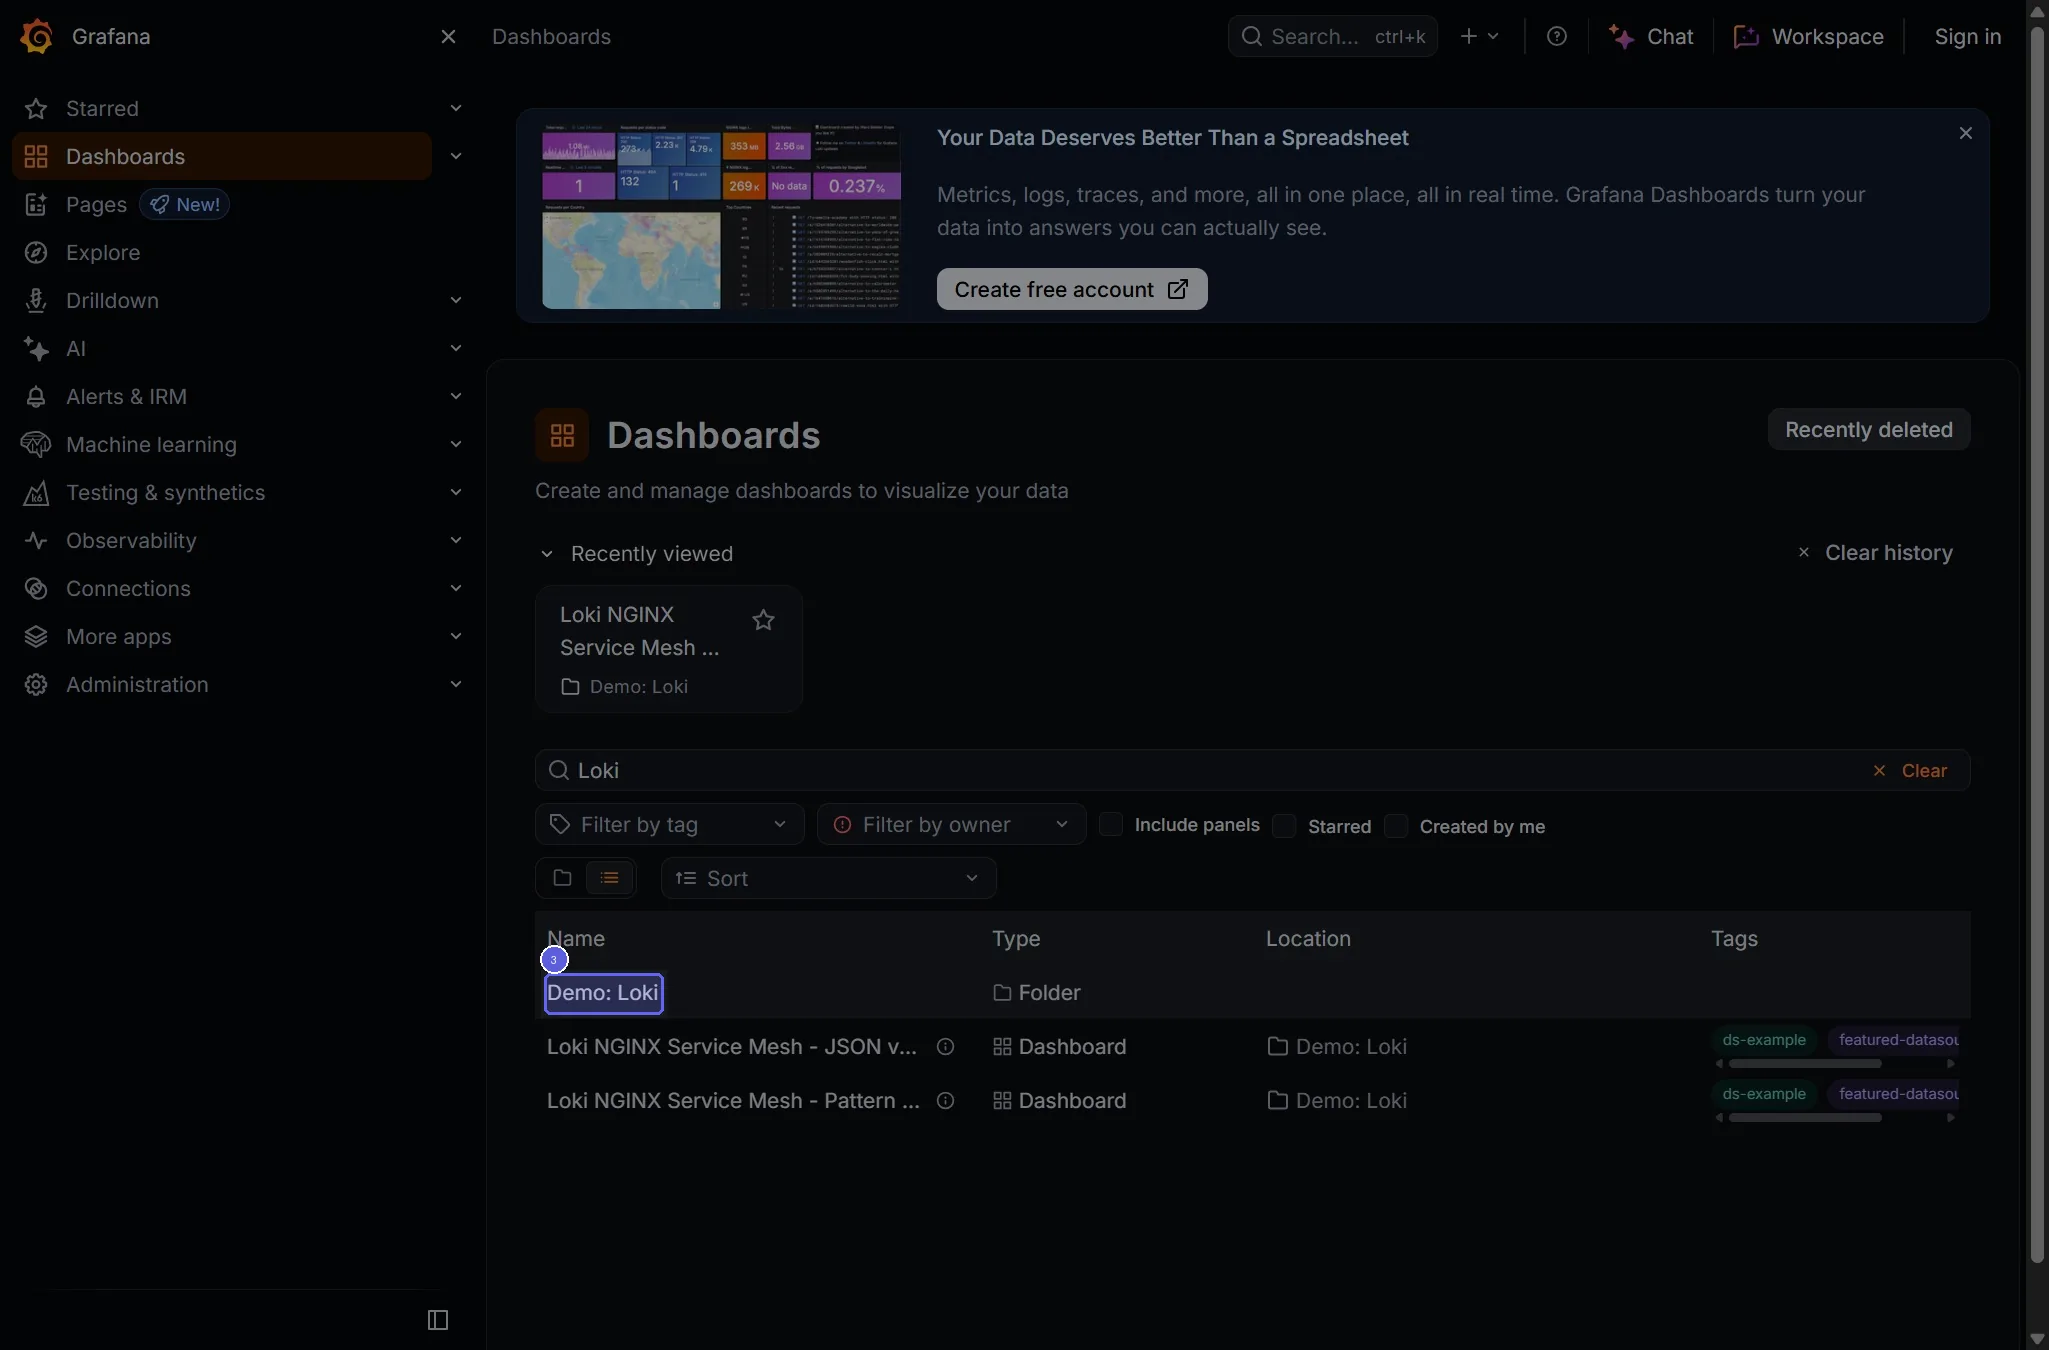
Step 4: Click the "Loki NGINX Service Mesh - JSON version" link
This opens the "Loki NGINX Service Mesh · JSON version · Demo: Loki · Dashboards" page.